
Tennis Betting Statistics: Using Data and Predictive Models for Smarter Wagers
 Available in US
html
I started betting on tennis with little more than rankings, gut instinct, and whatever pre-match commentary I could find. My results were mediocre – roughly break-even over two years. The turning point came when I began building spreadsheets of serve data and surface-specific performance metrics. Within six months, my ROI shifted from flat to consistently positive. Not because the data told me who would win – it does not, not with certainty – but because it told me where the market was wrong. That distinction is the entire foundation of statistical tennis betting.
Tennis is the most data-friendly sport for individual-match analysis. Two players, no teammates to complicate attribution, a scoring system that generates granular point-by-point records, and surface variations that create measurable performance differences. Random-forest models have identified serve strength as the single most powerful predictor of match outcomes, achieving accuracy above 80% in controlled studies. If you are not using data to inform your tennis betting, you are leaving edge on the table.
Contents
Key Statistical Indicators for Tennis Betting
A few years ago, I spent a weekend ranking every statistical input in my model by predictive power. The exercise was tedious – correlating individual metrics against match outcomes across 4,000 matches – but the results reshaped how I allocate my analytical time. Not all statistics are created equal. Some are central to predicting outcomes; others are noise that feels informative but adds nothing.
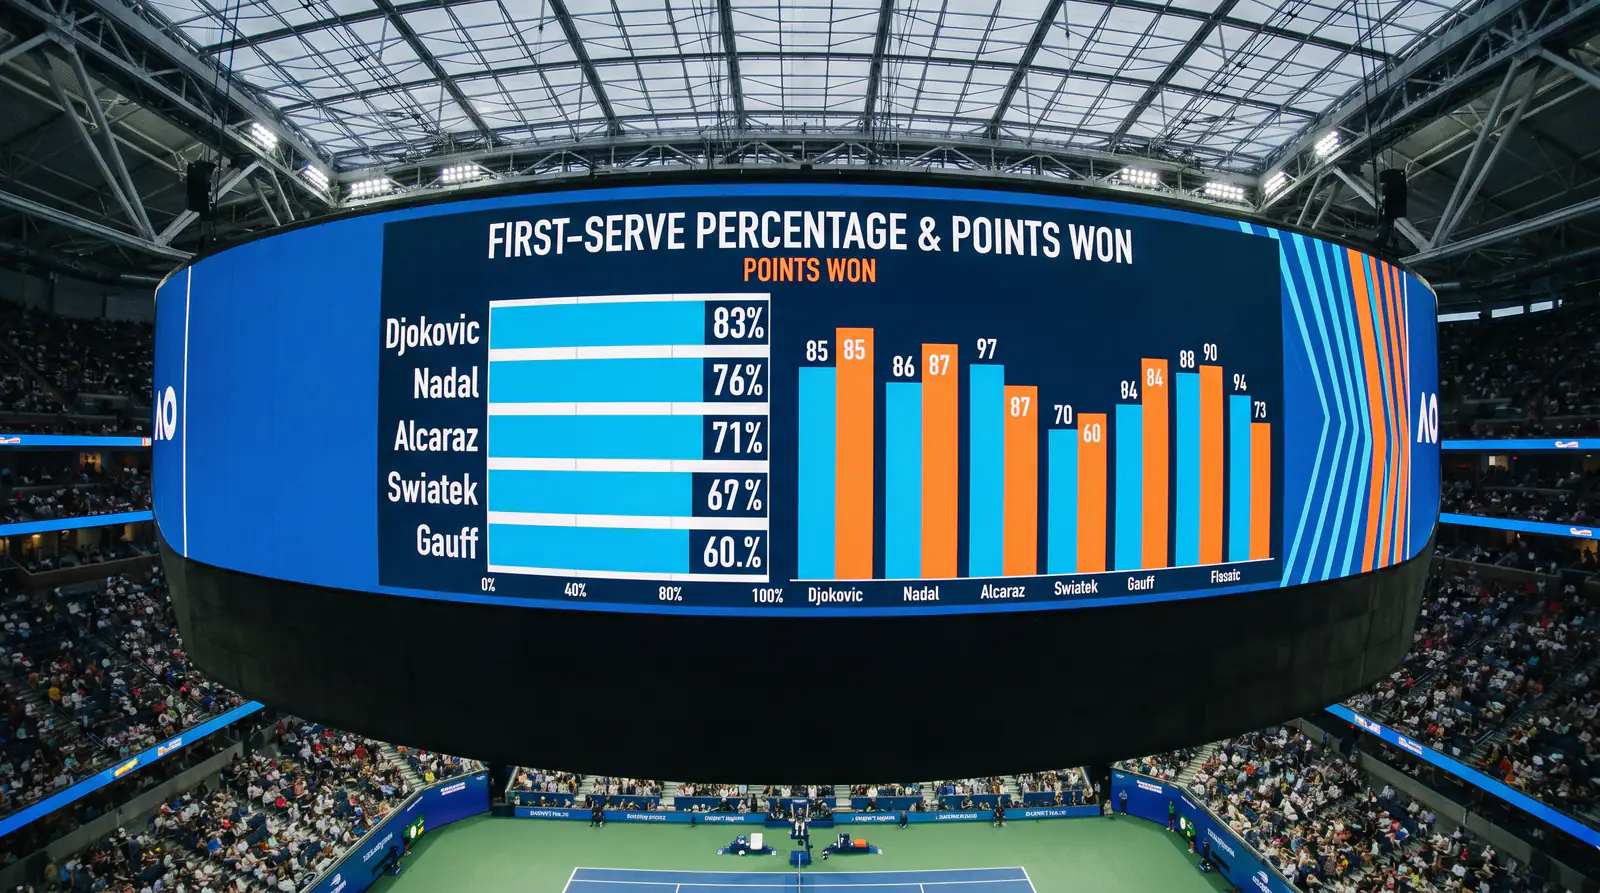
First-serve percentage and first-serve points won are the twin pillars. A player who lands 65% of first serves and wins 75% of those points is generating a fundamentally different match dynamic than one at 58% and 68%. The gap compounds over a three-set match – we are talking about a difference of 15-20 points won on serve, which translates directly into service holds and break-point frequency. Surface matters enormously here: first-serve efficiency averages 62.4% on clay, 64.2% on grass, and 67.5% on hard courts, so a player who appears average on hard courts might be elite on clay relative to that surface’s baseline.
Second-serve points won is the third indicator I weight heavily. The second serve is where vulnerability lives. A player winning fewer than 50% of second-serve points is under severe pressure in every service game, and against a strong returner that figure drops further. I find that second-serve performance is the most underpriced input in bookmaker models – partly because casual bettors focus on aces and winners rather than the defensive metrics that actually determine match outcomes.
The ATP’s introduction of full electronic line-calling through Hawk-Eye Live across all tournaments from 2026 has been a quiet revolution for statistical analysis. Challenge data – which previously introduced noise through human line-calling errors – is now irrelevant, and every point is tracked with consistent precision. This means the statistical records from 2026 onward are cleaner and more comparable than any previous era, which improves model accuracy for anyone working with recent data.
Return-game statistics complete the picture. Break-point conversion rate, return points won, and return games won collectively describe a player’s ability to disrupt the opponent’s serve. These metrics are more volatile than serve metrics – a player’s return game fluctuates match to match more than their serve – but over a 10-match sample they become reliable enough to differentiate genuine return strength from random variation.
Predictive Models: From Elo Ratings to Machine Learning
My first predictive model was a modified Elo system I built in a spreadsheet. It assigned each player a numerical rating and updated it after every match based on the result and the quality of the opponent. The elegance of Elo is its simplicity: two inputs – current ratings and the match result – produce a continuously updated probability estimate. I still maintain Elo ratings as a baseline, but my approach has evolved considerably since then.
Surface-specific Elo was the first meaningful upgrade. A player’s hard-court Elo might differ from their clay Elo by 100-200 points, which translates into substantially different win probabilities. Maintaining three separate Elo tracks – clay, grass, hard – requires more data management but produces significantly better predictions during surface transitions when aggregate Elo is misleading. The strategic implications of surface-specific ratings are enormous for identifying mispriced matches during the first weeks of each surface season.

Regression models add a second analytical layer. Rather than updating a single rating after each match, regression models use multiple input variables – serve statistics, return statistics, recent form, surface history, fatigue indicators – to generate a probability estimate for each match. These models handle the nuance that Elo cannot: a player returning from injury might have a respectable Elo but degraded serve data that suggests a lower win probability than the rating implies. I use logistic regression for most of my modelling because the output is a direct probability estimate rather than a classification.
Machine learning sits at the analytical frontier. The random-forest models achieving above-80% accuracy in published research use ensembles of decision trees that identify non-linear relationships between inputs. A human analyst might miss the interaction between second-serve speed and altitude, but a random-forest model captures it automatically if the pattern exists in the training data. The limitation is interpretability: these models tell you the answer but not always why, which makes it harder to identify when the model is extrapolating beyond its training range.
I use a hybrid approach. Elo provides the baseline probability. Regression adjusts for current form and serve data. I manually review the output for contextual factors – motivation, scheduling, known injuries – that no model captures well. This layered method is slower than a fully automated pipeline but catches the edge cases that pure model output misses.

Where to Find Tennis Data and How to Use It
The data landscape for tennis has transformed over the past five years. Sportradar’s acquisition of IMG Arena’s betting data portfolio for USD 225 million in 2026 signalled the commercial value of high-quality match data, and that investment has trickled down to bettors through improved public data availability – even though the premium feeds remain expensive and largely inaccessible to retail users.

Free data sources form the foundation for most independent tennis bettors. The ATP and WTA websites publish match-level statistics including serve and return data for every tour-level match. Third-party databases aggregate this data into downloadable formats that are suitable for spreadsheet analysis or model training. Point-by-point data – which is essential for building more sophisticated models – is harder to access for free but available through academic datasets and specialised tennis analytics communities.
The gap between free and premium data is narrowing but still significant. Premium feeds from data providers include real-time point-by-point updates, detailed tracking data like serve speed and placement, and historical records going back decades with consistent formatting. If you are building machine-learning models, the quality and consistency of your training data matters enormously – garbage in, garbage out is not a cliche in this context but a precise description of what happens when you train on messy datasets.
My practical advice for someone starting out: begin with the free ATP and WTA statistical summaries. Build a simple Elo model to generate baseline probabilities. Compare your model’s output to the market odds for 200-300 matches without betting a penny. If your model consistently identifies discrepancies that resolve in your favour, you have a foundation to build on. If it does not, refine the model before risking any money. The data will not run away – but your bankroll will if you deploy an untested model with real stakes.

Articles
Written by the editors at bettennisonline.com.
