
Tennis Betting Odds: Formats, Comparison and How to Spot Value in UK Markets
 Available in US
I still remember the first tennis bet I placed — a match winner on a clay-court qualifier in Barcelona, back in 2015. The fractional odds read 5/2, and I had no real sense of what that number was telling me about probability. I just liked the player. That bet lost, but the experience planted a question that has driven eleven years of my work: what are odds actually saying, and how do I read them better than the next person?
Tennis betting odds are the language of the market. Every number on a bet slip is a compressed opinion — a blend of statistical modelling, trading-desk instinct, and the weight of money from thousands of punters. Learning to read that language fluently is the single most important skill in this game, and it separates recreational bettors from those who grind a genuine edge over months and years.
In the UK, tennis accounts for roughly 8% of all sports betting activity, sitting behind football and horse racing but growing faster than either. Tennis is projected to be the fastest-growing segment in online sports wagering, with a compound annual growth rate of 13.83% through 2031. That growth means more money flowing into tennis markets, sharper odds, and — for those who know where to look — more opportunities where the market gets a price wrong.
This guide walks through everything I wish someone had shown me before that Barcelona qualifier: how the three main odds formats work, how bookmakers build a tennis price, where to compare them, how to read movement before first serve, and — most importantly — how to identify the moments when a price doesn’t match reality. Every concept includes a worked example, because odds without numbers are just theory.
Contents
Fractional, Decimal and American: How Each Format Works
Three years into tracking tennis markets full-time, I flew to Melbourne for the Australian Open. Sitting in the press area, I watched a colleague from a European trading desk quote odds in decimal, while the British punter beside me talked fractional, and an American journalist kept converting everything to moneyline. They were all describing the same match. The confusion was entirely avoidable — and it disappears the moment you understand what each format is actually doing.
Fractional Odds
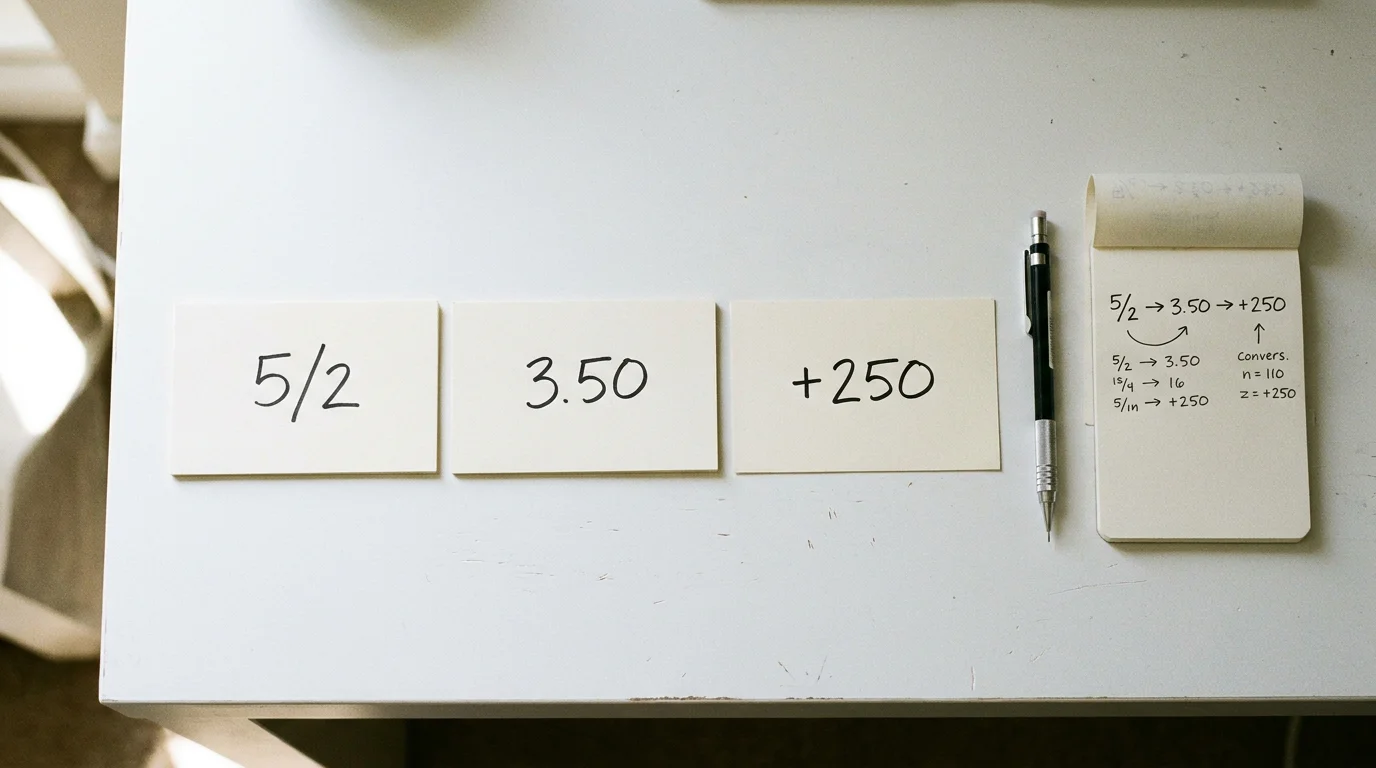
Fractional odds are the traditional UK format. A price of 5/2 means: for every 2 units you stake, you receive 5 units of profit if the bet wins. Your total return is the profit plus your original stake. So a 10-pound bet at 5/2 returns 35 pounds — 25 profit plus the 10 you put down.
The key relationship to internalise is that fractional odds directly express the ratio of profit to stake. Odds of 1/1 (evens) mean equal profit and stake — you double your money. Odds shorter than evens, like 4/9, mean the payout is less than your stake — the market considers that outcome more likely than not. Odds longer than evens, like 3/1, mean the market considers it less likely.
To convert fractional odds to an implied probability: divide the denominator by the sum of numerator and denominator. For 5/2: 2 / (5 + 2) = 0.2857, or 28.57%. That is the probability the bookmaker’s price implies for that outcome.
Decimal Odds
Decimal odds represent the total return per unit staked, including the stake itself. A price of 3.50 means a one-pound bet returns 3.50 pounds total — 2.50 profit plus the 1.00 stake. This format dominates continental Europe and is increasingly popular on UK platforms because the maths is simpler: multiply your stake by the decimal price to get the total return.
Converting from fractional to decimal is straightforward: divide the fraction, then add one. So 5/2 becomes (5 / 2) + 1 = 3.50. Going back: subtract one from the decimal, then express as a fraction. 3.50 becomes 2.50, which is 5/2.
Implied probability from decimal odds: divide one by the decimal price. For 3.50: 1 / 3.50 = 0.2857, or 28.57% — identical to the fractional calculation, as it should be.
American Odds
American (moneyline) odds use a different logic depending on whether the number is positive or negative. A positive figure like +250 tells you the profit on a 100-unit stake: bet 100, profit 250. A negative figure like -150 tells you how much you must stake to profit 100: bet 150 to win 100.
You will encounter American odds mainly on US-facing platforms and in cross-market discussions, but some UK sites display them as an option. The conversion to implied probability: for positive odds, divide 100 by (the odds + 100). For +250: 100 / 350 = 28.57%. For negative odds, divide the absolute value by (the absolute value + 100). For -150: 150 / 250 = 60%.
Which Format Should You Use?
I work in decimal. Not out of preference for elegance, but because comparing prices across bookmakers is faster when every number is in the same format and the return calculation is a single multiplication. Most UK betting platforms let you toggle between formats in the settings. Pick one, learn to think in it natively, and stop converting mid-analysis. The mental overhead of switching formats mid-session costs more than people realise — not in money directly, but in decision speed when a live market is moving.
How Bookmakers Set Tennis Odds
A question I get asked constantly: does a bookmaker just pick a number? The reality is far more mechanical — and understanding the machinery gives you an advantage over anyone who treats odds as arbitrary.
The process starts with a mathematical model. Every major UK bookmaker uses some variant of a ratings-based system — often Elo or Glicko derivatives — that ingests historical match data, surface-specific performance, recent form, and head-to-head records. The model outputs a raw probability for each outcome. For a hypothetical Wimbledon quarter-final, the model might say Player A has a 62% chance of winning and Player B has a 38% chance.
If the bookmaker priced those probabilities directly, the decimal odds would be 1.61 for Player A and 2.63 for Player B. Add those implied probabilities: 62% + 38% = 100%. A perfectly fair market. But bookmakers are businesses, not charities. They add a margin — called the overround or vig — which inflates the total implied probability beyond 100%. A typical tennis match might carry an overround of 104% to 108%, meaning the prices offered are slightly shorter than the “true” probabilities warrant.
In practical terms, those 62% and 38% raw probabilities might become 64.5% and 39.5% after the margin is applied, producing decimal odds of 1.55 and 2.53. The gap between the raw probability and the offered price is where the bookmaker earns its revenue. Football held 35.27% of the global online sports betting market share in 2026 — the sheer volume on football allows tighter margins there. Tennis markets, with lower liquidity, often carry a slightly wider overround, which is precisely why comparing prices across multiple bookmakers matters more in this sport than in any other I trade.
After the model sets the opening line, human traders adjust it based on qualitative factors: injury whispers, travel schedules, motivation (a player fighting for ranking points versus one already qualified for the Tour Finals). Then the market opens and money talks. If disproportionate volume lands on one side, the price shortens on that side and drifts on the other. As IBIA’s Khalid Ali has noted, higher activity volumes in mature markets often indicate stronger detection capability rather than higher inherent risk — a principle that applies equally to how quickly bookmaker trading desks spot and respond to informed money.
The entire process — model, trader, market — happens within hours before a match and continues in real time once play starts. Understanding this chain means you know where each price comes from and, more importantly, where it might be wrong.

Comparing Odds Across UK Bookmakers
Last summer, I tracked the odds for every ATP 500 quarter-final across six UK bookmakers over a two-week window. The average price difference on match-winner markets was 3.2% in implied probability terms. On one match — a tricky indoor hard-court clash between a big server and a counterpuncher — the gap widened to 7.1%. That is not a marginal difference. Over a year of betting, consistently taking the best available price instead of the first one you see compounds into a significant improvement in returns.
The UK sports betting market is projected to reach $21.3 billion by 2030, growing at 11.4% annually. That growth fuels competition, which in theory should tighten odds across operators. In practice, different bookmakers still use different models, different margin structures, and different risk appetites for tennis. Some operators actively court tennis volume with competitive pricing; others treat it as a secondary sport and price it conservatively.
Comparing odds manually is tedious. I use a dedicated odds-comparison workflow — checking three to four platforms before placing any pre-match bet. The process takes under a minute per market and over the course of a year has added roughly 1.5 percentage points to my strike rate in profit terms. That sounds small. It is not. Compounded over hundreds of bets, that margin is the difference between a losing year and a profitable one.
What to look for when comparing: focus on decimal odds to at least two decimal places. A price of 2.50 versus 2.45 on the same outcome represents a difference that matters once you multiply it by your stake size and bet frequency. Pay particular attention to the underdog side of the market — bookmakers tend to agree more closely on short-priced favourites (the model confidence is higher), and the real variation often sits on the longer-priced player, where your edge is also typically larger.
One practical note: some UK platforms restrict or limit accounts that consistently shop for the best price. This is a reality of the industry, not a myth. The workaround is not to chase bonuses or create multiple accounts, but to maintain activity across several platforms with a diversified betting pattern. The goal is access, not exploitation.

What Odds Movement Tells You Before a Match
I once watched a WTA match in Madrid where the favourite’s price drifted from 1.45 to 1.72 in the space of ninety minutes before first serve — no injury announcement, no weather change, nothing on the news feeds. Two hours later, the favourite lost in straight sets. The money knew something the public didn’t. Odds movement is the market’s heartbeat, and reading it is a skill that separates informed bettors from passengers.
Pre-match odds movement in tennis falls into three broad categories. The first is model-driven adjustment: the opening line was set too early, fresh data arrives (a practice-session result, a confirmed doubles withdrawal indicating fatigue), and the trading desk recalibrates. This kind of drift tends to be gradual and affects both sides of the market proportionally.
The second category is money-driven movement. When a large volume of stakes lands on one side, the bookmaker shortens that price to balance its liability. This is the type of movement that matters most for identifying value. If the favourite shortens sharply without any public news, it often signals that professional or syndicate money has entered the market based on private information or superior modelling. Conversely, if the underdog shortens — known as a “steam move” — it can indicate that sharp bettors believe the public is overvaluing the favourite.
The third category is liquidity-driven noise, particularly on lower-tier matches where a single large bet can move the line significantly. On an ATP 250 first-round match, one punter placing a few thousand pounds can shift the price by 5% or more. On a Grand Slam semi-final, the same amount barely registers. Recognising the tier and the likely liquidity behind a market helps you distinguish signal from noise.
Live betting accounted for 62.35% of the entire online sports betting market in 2026. That figure tells you where the real volume sits — and it means pre-match odds are increasingly treated as a starting point, not a final price. Tracking how a price moves from opening to the moment of first serve gives you a compressed narrative of everything the market has learned in that window. I record the opening price and the price at fifteen minutes before match start for every bet I track. Over time, the pattern of those movements teaches you to read the market’s intent.

Identifying Value: When the Market Misprices a Player
Value is the only word in betting that actually matters. Everything else — systems, streaks, gut feelings — is decoration. A value bet exists when the probability you assign to an outcome is higher than the probability implied by the bookmaker’s odds. That gap is your edge. Without it, you are donating money to the operator’s margin, slowly and inevitably.
The concept is simple; the execution is not. To identify value, you need two things: the bookmaker’s implied probability (which you now know how to calculate from any odds format) and your own estimate of the true probability. The second number is where the real work lives.
Suppose a bookmaker prices a WTA quarter-final at 2.80 for the underdog. That implies a 35.7% win probability. Your model — built from surface-adjusted win rates, serve data, recent form, and head-to-head record — estimates the underdog’s true probability at 42%. The difference between 42% and 35.7% is your edge. In expected-value terms: (0.42 x 1.80 profit) – (0.58 x 1.00 stake) = +0.176. For every pound wagered, you expect to gain 17.6 pence over the long run. That is a substantial positive expected value and a clear signal to bet.
The UK accounts for 11.1% of the global sports betting market by revenue — a mature, competitive market where odds are generally efficient. Finding value here is harder than in emerging markets, which makes the discipline of probability estimation even more critical. Casual bettors tend to overvalue recent results (a player who won last week “must be in form”) and undervalue structural factors like surface transition, scheduling fatigue, and the gap between indoor and outdoor hard courts. Those structural blind spots are where mispricing lives.
I keep a spreadsheet that logs every bet with my estimated probability, the bookmaker’s implied probability, and the actual outcome. After a thousand bets, the pattern is clear: the bets where my estimated edge exceeded 5% returned a profit over time; the bets where I chased thin edges (1-2%) broke roughly even after the overround ate into returns. The threshold matters. A deeper exploration of how to build and maintain that edge is covered in the guide to tennis value betting, but the principle starts here — if you cannot articulate why the price is wrong, you do not have a bet.
Common mispricing patterns in tennis include: clay-court specialists playing early rounds at non-clay events (the market overweights their overall ranking and underweights their surface disadvantage), players returning from a brief injury break (the market overreacts to the absence and underweights the rest benefit), and late-night scheduling on the US hard-court swing (fatigue and time-zone effects that models often ignore). Each of these represents a repeatable pattern, not a one-off hunch.

How Odds Differ Across Tennis Markets
Not all tennis markets carry the same margin, and understanding where the overround sits thickest will save you money over the course of a season. Match-winner odds on a Grand Slam semi-final might carry a total overround of 103-104% — tight, competitive, well-modelled. A correct-set-score market on the same match could sit at 115-120%. The bookmaker knows that exotic markets attract recreational money, and it prices the margin accordingly.
Match-winner markets are the most liquid and the most efficiently priced in tennis. The two-outcome structure (ignoring the rare dead-heat scenario) means the overround is spread across just two prices, and competition between bookmakers keeps it tight on high-profile matches. This is the market where value is hardest to find but also where your analysis is least diluted by margin.
Game handicap and set handicap markets introduce a spread element. The odds here are typically structured around a central line — say, -4.5 games for the favourite — with prices on either side of that line. The overround tends to be slightly higher than match-winner because the bookmaker is pricing a more granular outcome. The advantage for the informed bettor is that handicap markets let you express a view on the margin of victory, not just the winner. If your analysis says the favourite wins comfortably but the match-winner price is too short to offer value, the handicap market might provide a better entry point.
Total games (over/under) markets carry a similar overround to handicaps. The line — often set around 21.5 or 22.5 for a best-of-three match — reflects the expected total number of games. Surface has a massive effect here: a grass-court match between two big servers will see a lower line than a clay-court rally between two baseliners. The over/under market is where surface-specific knowledge translates most directly into an edge, because the models bookmakers use sometimes lag behind real surface conditions (court speed changes year to year, even at the same venue).
Outright and futures markets — backing a player to win an entire tournament — carry the highest overround of any tennis market, often 130-150% when you add up the implied probabilities of every player in the field. The margin is enormous because the bookmaker is pricing a large number of outcomes with significant uncertainty. Despite this, outright markets can still offer value because the public tends to overweight recent narratives (last year’s champion, the “next big thing”) and underweight draw-dependent paths and surface transitions during a tournament.
The practical takeaway: concentrate your analytical effort on the markets where the overround is lowest and your information advantage is strongest. For most bettors, that means match-winner and game-handicap markets on ATP and WTA events at the 500 level and above. Save the exotic markets for situations where you have a specific, data-backed reason to believe the price is significantly wrong — not just a hunch that “anything could happen”.

Frequently Asked Questions About Tennis Betting Odds
Articles
Written by the editors at bettennisonline.com.
